


Definition
This covers the process of visualizing 3D image datasets in software, including those taken from Computed Tomography (CT), Micro-Computed Tomography (micro-CT or X-ray), Magnetic Resonance Imaging (MRI), and other sources. Efficient 3D image visualization is crucial as the first step in the processing and analysis of image data, for example when trying to understand complex structures in medical or industrial applications.
What Problems Does 3D Image Visualization Solve?
By using 3D image visualization, the problem of virtually reproducing a scanned object can be overcome. The foundation for creating these 3D models come from the high-resolution imaging now possible with MRI and CT scans, which can effectively capture the detail of tissue and bones or industrial and material parts. In terms of the latter example, 3D image visualization is valuable for non-destructive evaluation of defects and the internal features of a part, making it less costly than running tests on actual components
How Does 3D Image Visualization Work?
In MRI machines, greyscale intensity is related to the strength of the signal emitted by proton particles during relaxation, and after the use of very strong magnetic fields. As different tissues have varying concentrations of protons, different greyscale intensities are used to create the image. By comparison, in a CT scan, the greyscale intensity at a particular voxel relates to the X-ray absorption by the subject at a particular location.
From these processes, a reconstructed image volume is obtained: Raw data taken from a CT or MRI scanner is converted into tomography images for visualization, which is typically completed using the software associated with the scanner itself. A 3D bitmap of greyscale intensities is the result, wherein a voxel (3D pixels) grid is produced. This image data can then be imported to software and visualized in different ways.
For example, in Synopsys Simpleware software, 3D image visualization can involve the following options:
- The background volume can be GPU rendered for quick and easy visualization of the 3D data, creating a realistic object that can be interacted with by the user.
- Live 3D rendering can be used to carry out instant changes to the image, including lighting, transparency, background gradients, and model shading, making it straightforward to create a more realistic-looking model, depending on the application.
- 3D stereoscopic visualization can be applied, for example in modes such as checkerboard, anaglyph, and crystal eyes, to provide a different perspective on the image data.
Where and When Does 3D Image Visualization Fit in the Product Portfolio?
Accurate 3D image visualization is the crucial foundation of any planned analysis of a scanned object, and also provides value in its own right by making it easy to communicate how complex structures are formed, and their different regions, for example when planning a surgery or exploring a prototype. In these cases, 3D printing of the image data also allows for the visualization to be translated into a physical part.
Synopsys Simpleware software keeps image data at the center of its extensive 3D image processing solution. The core Simpleware ScanIP software environment contains the previously discussed capabilities for importing and visualizing 3D images, as well as options for further processing and analysis of this type of data.

Go Beyond 3D Image Visualization
3D image visualization is effective for quick representations of objects, and for producing high-quality demonstrations. In this respect, the method is valuable as a teaching aid, and for exploring the inside of the human body or a valuable industrial part without invasive or destructive actions.
In most cases, however, 3D image visualization is only the first step in a 3D image processing and model generation workflow. Compared to 3D image visualization, for example, 3D image processing involves a wider range of different tasks when working with 3D image data, which can involve steps such as:
- Using image filters to remove unwanted noise or artifacts from the original scans.
- Segmenting regions of interest and further 3D rendering of the resulting model
- Generating animations from the image data, for example, to rotate the 3D model or ‘fly-through’ its interior.
- Obtaining measurements and carrying out statistical analysis.
Other examples of next steps for 3D image visualization are provided below:
- Exporting STL data for additive manufacture of the prepared models.
- Generating a volume mesh for physics-based simulations such as Finite Element (FE) or Computational Fluid Dynamics (CFD).
- Exporting CAD-friendly NURBS files for further design work.
- Combining image data with CAD files to observe and plan component interactions with imaged subjects.
- Calculating effective material properties of a material microstructure using FE-based homogenization.
How is 3D Image Visualization Being Applied to Real-World Cases?
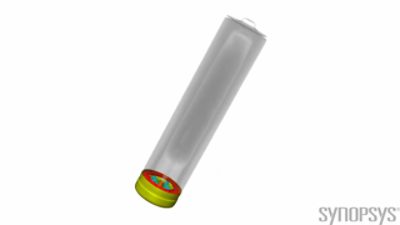
One example of where 3D image visualization techniques have been applied when using Simpleware software is in improving our understanding of batteries. Lithium-ion and other types of batteries require significant investment in R&D to meet consumer demands, with 3D image visualization and processing crucial to these workflows. Work carried out with Micro Photonics used micro-CT data of AAA batteries to investigate different questions about their structure.
- Micro-CT scans are used to acquire the image data of the AAA battery.
- Data is imported to Simpleware ScanIP for 3D visualization by mapping greyscale information to color and opacity for 3D rendering, using focus contrast to highlight features of interest.
- The Simpleware local correction filter is used to carry out rough segmentation on greatly down-sampled scans, before transferring to a full resolution for a filter. This kind of approach is important when visualizing large 3D image datasets, as initial processing can be run quickly and reduces the impact of beam hardening artifacts.
- Measurements, volume statistics, and centreline analysis are used to quantify the battery.
- The processed 3D model is then analyzed using dataset registration and comparison to look at the differences between CAD design and the actual scanned geometry of a part.
- From this workflow, it is straightforward to visualize and segment an AAA battery without damaging the actual part, creating insights into defects and differences between a designed and manufactured battery.
Continue Reading


Cloud HPC for AI: Addressing Latency, Cost, and Scale at the Architectural Level

