
Mastering AI Chip Complexity
Explore challenges and solutions in AI chip development
Download eBook
These notes are intended to clarify or expand upon points made in the companion article, "A Gentle Introduction to Optical Design." Of course these explanations are very brief, so if you want more information, please see the references in the original article.
This is optics, but it's not optical design! But of course we'll give the answer: Rayleigh scattering. What does this mean? Visible light is one form of electromagnetic radiation, with wavelengths from about 0.35 micrometers (violet) to about 0.75 micrometers (red). Although light travels mostly in straight lines, it can also be scattered by particles such as air molecules, meaning that portions of the light energy are sent off in various directions. The directions are determined by the relationship between the size of the wavelength (which determines the light's color) and the size of the scattering particles. For our atmosphere, this effect is strongest in the shortest wavelengths, decreasing almost to 0 at the red wavelengths. Because visible light is most intense at 0.5 micrometers (which we see as blue), scattering at this wavelength is dominant and the sky appears blue.
For a more detailed explanation, take a look at this web site.
(Remember, you can use your browser's BACK button to return to your previous point -- if you came from OPTICS FOR KIDS, you can also click here to go back to "Some Questions Scientists Might Ask About Light.")
Although optical designers make use of laser light in many systems they design (such as supermarket product scanners and CD players), the basic principle of a laser depends on the photon nature of light. Photons are particles of energy that can be absorbed into and emitted from atoms and molecules. When an atom absorbs a photon of light energy, the atom stores this extra energy temporarily (we say the atom is in a higher energy state). When the atom "relaxes" to its natural low-energy state, it gives up the excess energy in the form of another photon (we call this spontaneous emission -- it just happens). Lasers are possible because of another type of photon emission called stimulated emission. If you can somehow get a LOT of atoms into specific higher energy states, you can use light to trigger or "stimulate" all of them into releasing their excess-energy photons at the same time (we say these photons are in phase, or coherent). There are various ways to get a lot of atoms into the same high energy state (this is called "pumping" the laser), and there are various ways to contain them long enough to build up a big "pulse" of light energy. Lasers are really fascinating -- see the references to learn more.
Experiments with light can lead to different conclusions about its fundamental nature. Inside a laser, and in many light detectors (such as those found in a video camera), light behaves quite clearly like a stream of particles, each one of which carries a certain, fixed amount of energy - what we call photons. But when light from the laser is passed through two closely-spaced pin holes, the resulting interference pattern is similar to the pattern of ripples seen when two rocks are dropped into water to form interfering water waves. The laser light clearly acts like a wave in many respects. Yet it is the same light. We often refer to this schizophrenic behavior as wave/particle duality.
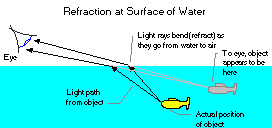
Snell's Law was discovered in 1621 -- you might remember it from high school physics. It precisely defines how light is bent, or refracted, when it passes through a boundary between two media of differing index of refraction (n), such as air and glass or air and water (the angles theta-i and theta-t are the incident and transmitted angles, respectively). We notice refraction when we look at an object that's under water:
In a sense, all of geometrical optics is contained in Snell's simple expression, but in practice, optical engineers and computer programs use a large number of equations and techniques that are more convenient for working with lenses and other optical components.
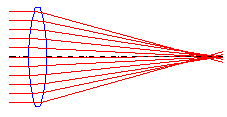
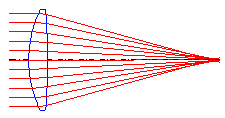
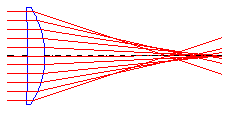
Lenses come in many shapes and sizes, and many optical systems make use of multiple lens elements to bend the light in just the right way to form images as required while minimizing aberrations. A basic distinction is between a positive (focusing or converging) lens and a negative (diverging) lens:
Positive or converging lens:
Negative or diverging lens:
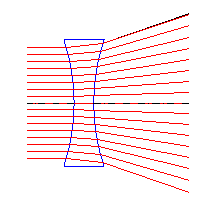
Although these particular examples are symmetric in shape (front and back curvatures are equal but opposite in sign), most lens elements are not symmetric. The curvatures, glass properties, and thickness all affect the way that the lens alters the path of light passing through it. Determining these parameters (usually for a number of lenses working together) is the job of the optical designer.
There are many ways to evaluate an optical system model using optical design software. When we say "evaluate," we really want to simulate the lens before it is built, and predict how it will perform. Imaging systems try to bring light to a sharp focus, but we need to be more precise than this. Some of the more common evaluations are spot diagrams, encircled energy, and MTF. Spot diagrams are graphs that show where rays from a point object will fall on the image surface (they must fall close together if the lens is to form a good image). Encircled energy is a way of measuring how the energy (determined by counting rays) in the spot diagram is distributed as a function of radius, measured from the center (usually displayed as a graph).
MTF is "modulation transfer function." It requires the idea of spatial frequency, which is just a measure of how parts of a scene are spaced apart. Think of a white picket fence with a dark house behind it. From a few meters away, you can easily see the contrast between the white and dark stripes. This is a low spatial frequency. Now consider a black comb against a white piece of paper. From a few meters away, you probably cannot even tell that there are dark and light stripes at all! This is a high spatial frequency, which you can think of as the fine detail in a scene. A lens (such as your eye) can image low spatial frequencies more easily than high frequencies. MTF is just a graph that shows this "frequency response" for a lens, from low to high frequency (every lens has a maximum or cut-off frequency, meaning there is always some level of detail that is too fine for the lens to detect).
Spot diagrams are graphs that show where rays from a point object will fall on the image surface (they must fall close together if the lens is to form a good image). The graph is usually highly magnified (as if you looked at the image spot through a microscope), and its shape can indicate the type and amount of aberration in the lens. Perhaps most distinctive is the aberration coma, whose name is fairly descriptive.
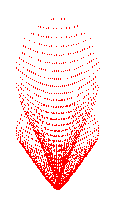
Coma looks like a comet:
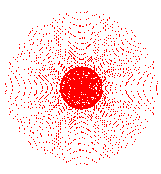
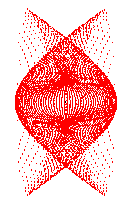
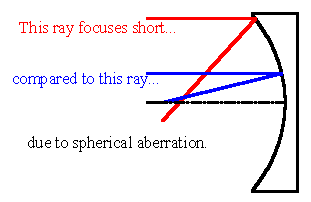
Spherical aberration is circular and concentrated at the center:
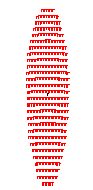
Simple astigmatism shows X-Y asymmetry :
This one has higher order astigmatism mixed with other aberrations:
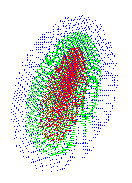
This is an off-axis point for glass singlet, and astigmatism gives the overall shape. The prism-like dispersion of glass focuses the red, green, and blue wavelengths differently. This is called chromatic aberration.
Lens bending refers to the relative values of front and back curvatures of a lens element. There are an infinite number of lenses (i.e., front and back curvature combinations) that will focus at a particular distance, but depending on how you "bend" the lens, the aberration will vary.
small
medium

vert large
The bending of each lens naturally affects lens quality. Lens designers use bending as one of their design parameters, usually in an implicit way (i.e., optimization programs determine the best bending in combination with many other factors and requirements).
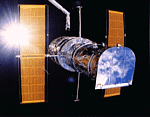
The Hubble Space Telescope (HST) is a large astronomical telescope that orbits the earth, allowing it to view distant objects without the disturbing effects of earth's atmosphere. An error was made in the fabrication of its large primary mirror, and unfortunately this error was not discovered until the HST was in earth orbit. The resulting spherical aberration prevented the HST from forming ideal images. Discovering the exact nature of the problem and inventing a fix required the work of many optical engineers, scientists, and designers from many organizations (including ORA). The repair mission to install "corrective lenses" restored the HST to nearly its design performance. For more information on the HST (and a lot of fascinating educational material on astronomy and other related subjects), visit the Web site at the Space Telescope Science Institute.


