
Synopsys Cloud
Cloud native EDA tools & pre-optimized hardware platforms
Request a Free Trial →
Join us for a special information session on
PIC Design using Synopsys OptSim Circuit and PhoeniX Software OptoDesigner
Feb 1, 2017, 10:00 a.m. – 12:00 p.m.
Synopsys and PhoeniX staff
Synopsys Booth #2117
This is a unique opportunity to meet the industry experts, understand PIC design flow starting from ideas to simulation and fabrication, and discuss your specific applications. Attendees interested in OptSim Circuit and OptoDesigner will have an opportunity to request evaluation copies onsite.
Many structures require custom index profiles to create them in the RSoft CAD Environment™. We previously described the method for entering a custom refractive index profile as an expression in an earlier enews. In this quick tip, we illustrate how to define a custom refractive index profile using a data file. We will take an index-graded fiber used in a few mode fiber applications as an example. The design files can be accessed in the RSoft enews section of the Customer Support Portal.
Figure 1 shows the structure used here: a 28 μm diameter index-graded fiber. The core center to cladding index difference is 0.01. The distribution follows the well-known graded fiber equation that we described in the June 2014 RSoft enews. In many cases, users have an experimentally measured index distribution data file as an absolution index value or as the index difference from a background index for a particular cross section.
Figures 2 and 3 show the RSoft data file format for absolute index value and index difference of the graded area, respectively. The absolute index data file covers a 50 μm x 50 μm area, including the cladding area. There are 501 points for x and y directions with 0.1 μm spacing. The index difference data file covers a 28 μm x 28 μm graded area. There are 281 grid points for x and y directions with 0.1 μm spacing. Please refer to the RSoft CAD Manual, Appendix B, for more detail information on the data file format. We will introduce two ways to import data for a user-defined profile and describe the advantages of each.

Figure 1: The index profile of graded index fiber with SiO2 cladding
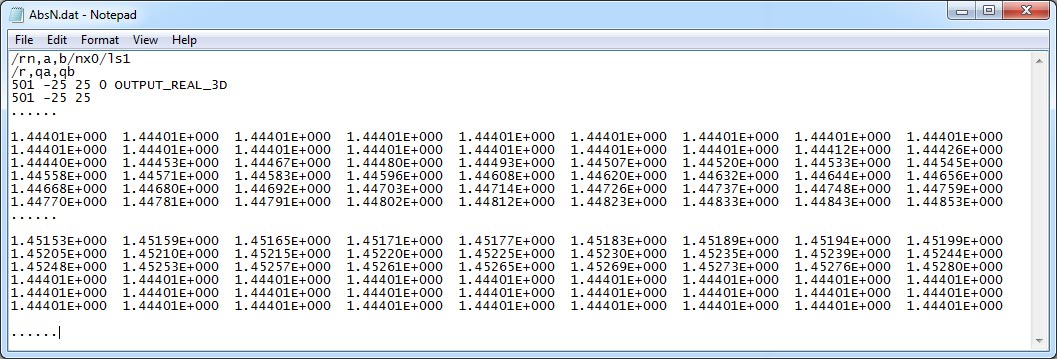
Figure 2: The absolute index data file for the whole region
(click for larger image)
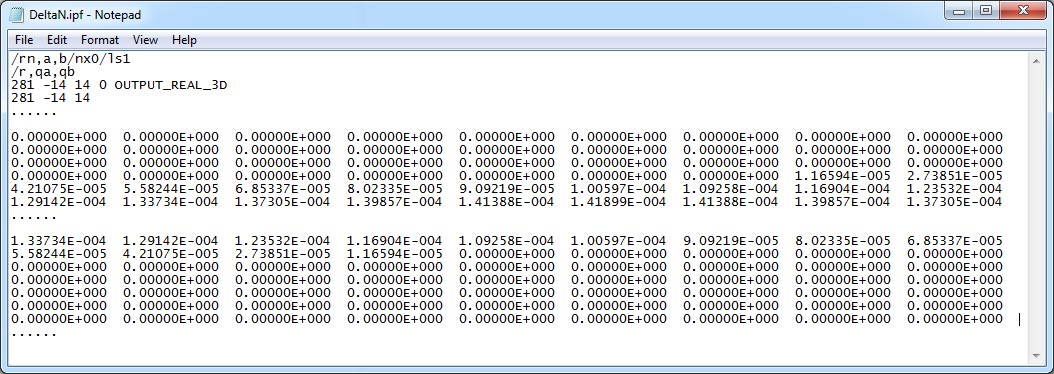
Figure 3: The index difference data file for the graded area
(click for larger image)
1. Import normalized index data file
By default, user-defined profiles (see Section 6.A in the RSoft CAD manual) normalize both the coordinate and refractive index information to achieve the final profile. The general index profile equation is written as
n(x',y') = n0 + Δnf(x',y'),
where x'=2x/w, y'=2y/h, and n0 is the background index and Δn is the index difference.
There are different ways to convert our measured data file to be used as f(x',y'). The simplest and most efficient way is to set Δn to 1 and change the data range to (-1,1) for x and y as shown in Figure 4.
A normalized user profile can be used for any components in the project with different widths and heights as well as use the same profile for different background indices. It offers the flexibility to use the same profile distribution in different environments. Figure 5 shows an example of how we can create different size waveguides at different locations with the same user profile. Furthermore, the background index can be set as a different number from the original file.
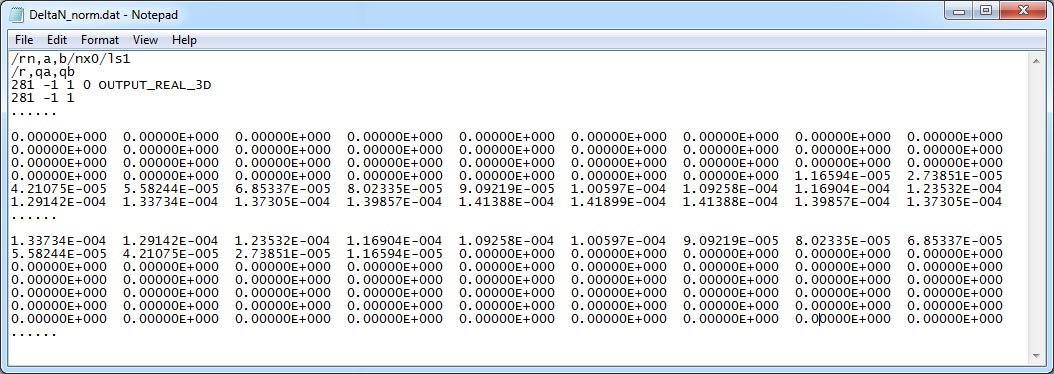
Figure 4: Normalized data file
(click for larger image)

2. Import absolute index value directly
By default, user-defined profiles use a normalized user profile. While this is useful for many cases, it is also useful to interpret a user-defined profile absolutely. To enable this option, select the Absolute index in User Profile option in the Global Index Generation Options dialog. When this option is used, the profile is translated from the coordinates defined in the expression/data file to the component center.
We can directly use the data file in Figure 2 for the four segments in the same design file. The index profile in Figure 7 shows that by using absolute index profile, the index profile is centered around each segment. But the size and index value don’t change according to segment size and the background index in the area of the original data file.

Figure 6: Global Index Generation

Figure 7: Index profile with the same absolute index value data file in four


