Cloud native EDA tools & pre-optimized hardware platforms
Photonic Solutions Enewsletter
Defining Patterned Surfaces Using Data Files and Adding Coating Layers
Many optical devices such as LED/OLEDs, DOEs (diffractive optical elements), and other patterned structures have complex or randomly textured surfaces. This type of surface can be defined in the RSoft CAD using a simple ASCII file from either measured data (AFM, other) or a user-created file. This article will illustrate how to create such a surface, as well as add a conformal coating layer to the surface. The design files can be accessed on SolvNetPlus (account required).

Figure 1: The structure described in this enews:
a) the surface relief map with original sample AFM data; b) AFM data file
Height Profiles
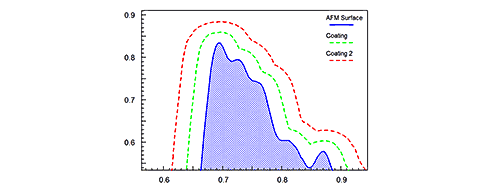
A textured surface can be created in the RSoft CAD with a height profile, which can be an expression or data file that defines the height of a multilayer segment (typically measured along Y) as a function of X/Z. This example uses the sample AFM data in the file afm.dat plotted in Figure 1. The file is in a normalized coordinate system; the exact size of the texture will be set later in the RSoft CAD. Note that the final structure will be rotated so that the surface normal is along the Z-axis as shown in Figure 1.
Adding a Coating
A coating can be added to a height profile surface by defining a second height profile with the desired surface height of the coating. This procedure is automated by the coatuf utility as illustrated in Figure 2.

Figure 2: Illustration of coatuf utility adding one or more coating layers on a surface
For this example, we add a 0.1 μm thick coating with a refractive index of 1.5 to the top of the surface that was defined via the sample AFM data. The coatuf command used here is:
coatuf -t0.1 -sx2.5 -sy5 afm.dat afm_coat.dat
where -t sets the coating thickness and -sx/-sy sets the X/Y scaling factors needed to properly apply the coating in the normalized coordinates used in the data file. The new coating height profile is saved in the afm_coat.dat file. See Section E.F in the RSoft CAD manual for more detail about the coatuf utility.
Drawing the Structure in the RSoft CAD
This structure is created using three segments in the RSoft CAD as shown in Figure 3.
- ‘Substrate’ Segment (Red)
The red segment is a simple channel segment and represents the substrate. Its size is set by the symbols Wtexture=5 (Component Width: X size) and Htexture=5 (Component Height: Y size) which corresponds to the actual X/Y size of the texture. Its refractive index is 2.4 which is set by the symbol Nsub.
- ‘Height Profile’ Segment (Yellow)

Figure 3: The structure as seen in the RSoft CAD. The yellow segment has the height profile defined and the red segment represents the substrate.
The yellow segment is a multilayer segment and uses the User 1 height profile defined with the sample AFM data. This segment uses a Layer Table (#0) that has a single layer with a large height truncated by the height profile and a refractive index of 2.4 defined by the symbol Ntexture. The final height of each point is the component height multiplied by the data in the file. Normally multilayer segments are defined in the XZ plane and the height is measured along Y. This segment is rotated by -90 degrees with Seg Extended in Segment Orientation setting and -90 degree value for Reference Theta in the Additional Component Properties dialog box. In this way, the ‘height’ axis is rotated to along the Z-axis. The segment rotation changes the definition of the Component Height and segment length. Specifically, the ‘length’ sets the size along Y (Htexture=5um) and the ‘height’ size along Z (Ttexture=1um).
- Coating Segment (Light Cyan)
This segment has the same setting as the yellow segment except that the height profile is defined as User 2 with the data file afm_coat.dat; Layer Table (#1) is set with the refractive index of the layer using the symbol Ncoat=1.5.
Viewing the Refractive Index
Click the Compute Material Profile button to view the refractive index profile of this structure. The results for the XZ plane and 3D Volume are shown in Figure 4.

Figure 4: The resulting refractive index profile: a) in the XZ plane, and b) 3D Volume.
You can see that the random textured surface is created along Z-axis with a uniform coating on top of it.
For more information about this example, please contact the RSoft Technical Support Team at rsoft_support@synopsys.com.
Silicon Photonics Workshop at the IEEE Group IV Photonics Conference
IEEE Group IV Photonics Conference
Grand Kempinski Hotel Shanghai
Shanghai, China
Tuesday, August 23, 2016
2:00 p.m. – 6:00 p.m.
Presented by the Synopsys RSoft Products team and PhoeniX Software
This pre-conference workshop will provide participants with an opportunity to learn how to design silicon photonics devices and integrated circuits. The workshop will have four parts:
- Overview of silicon photonics building blocks and basic circuits
- Design and optimization of passive and active photonic devices at the physical level
- Schematic-driven design and layout of photonic integrated circuits (PICs) using a foundry-provided platform design kit (PDK) and user-designed devices
- Mask layout of PIC designs, and procedures to export PICs to linked foundries for processing
The workshop provides hand-on sessions and all participants will have access to simulation and layout tools. In addition, participants may receive complimentary use of the tools after the workshop so they have an opportunity to complete and submit their designs to available foundries.


